Turn measurement into your strongest competitive advantage
Fospha is the Measurement Operating System for retail commerce — delivering daily, ad-level measurement that flows directly into the systems that act on it.
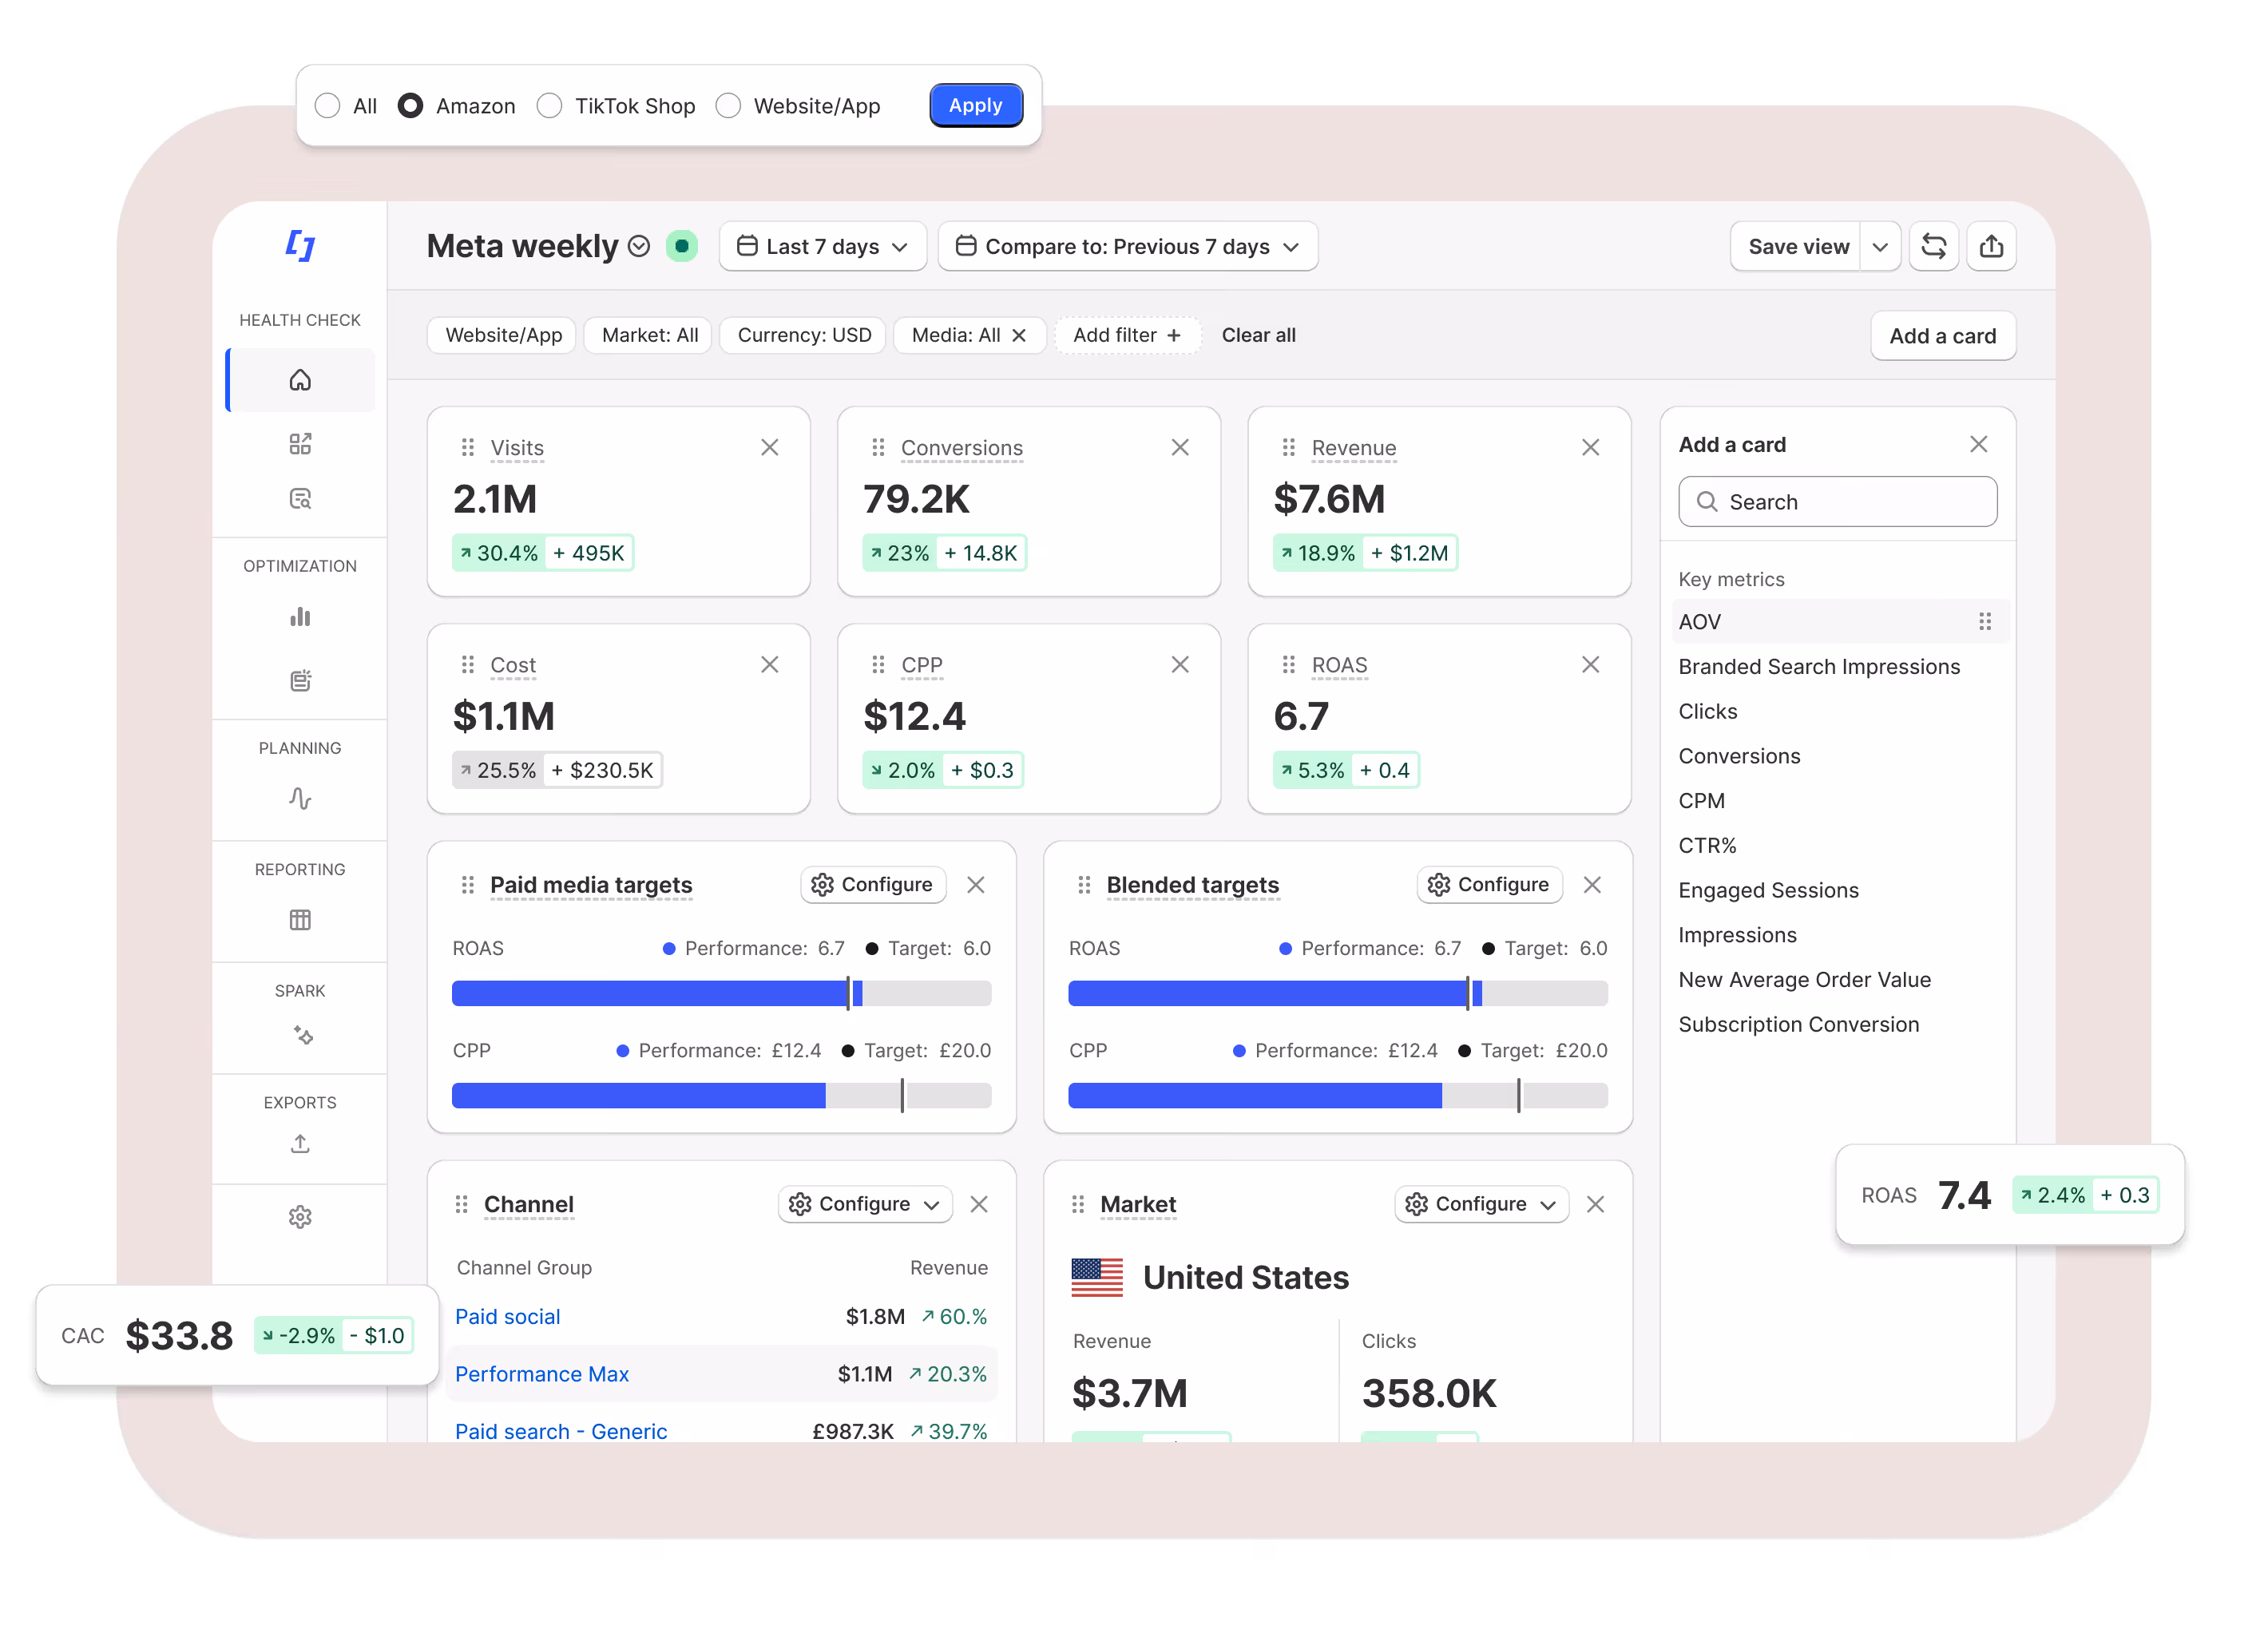


Core: Daily measurement
Unlike traditional MMMs that lag behind decision-making, Fospha provides always-fresh, cross-channel insights - right down to ad-level. It does the jobs MTA can’t, accurately attributing credit across the full funnel and surfacing directly comparable CPAs across platforms like Meta, TikTok, Google, and Amazon.
With a data pipeline powered by 100+ connectors and a team of data engineering experts, Fospha unifies your Web, App, eCommerce, Sales, and Marketing data to reveal what’s truly driving incremental growth, from impression to revenue.
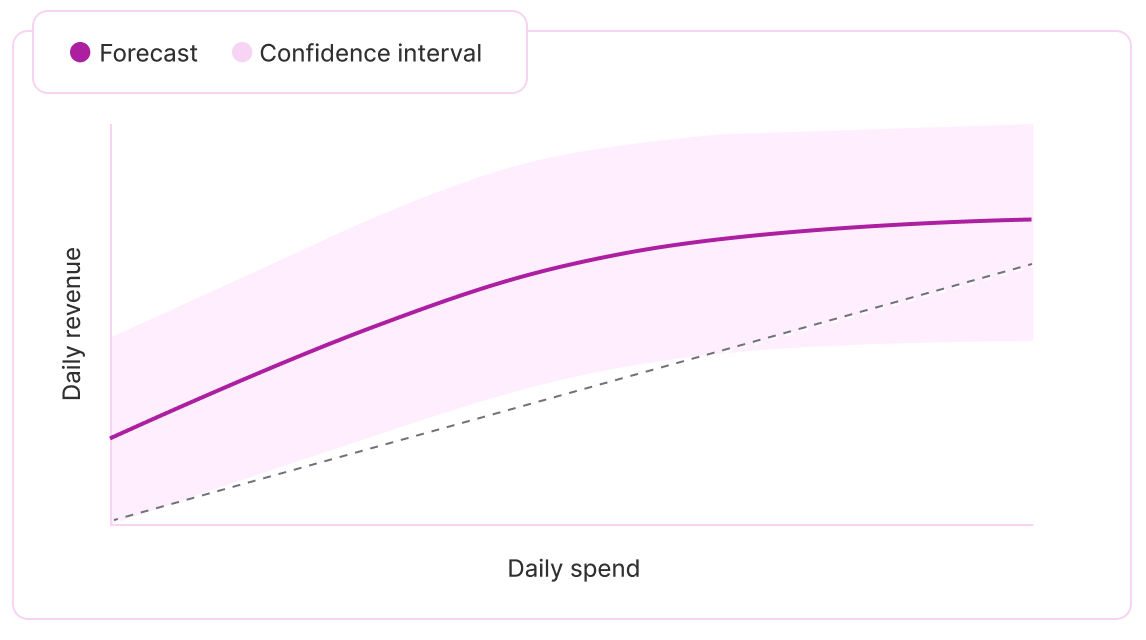
Beam: Incremental forecasting
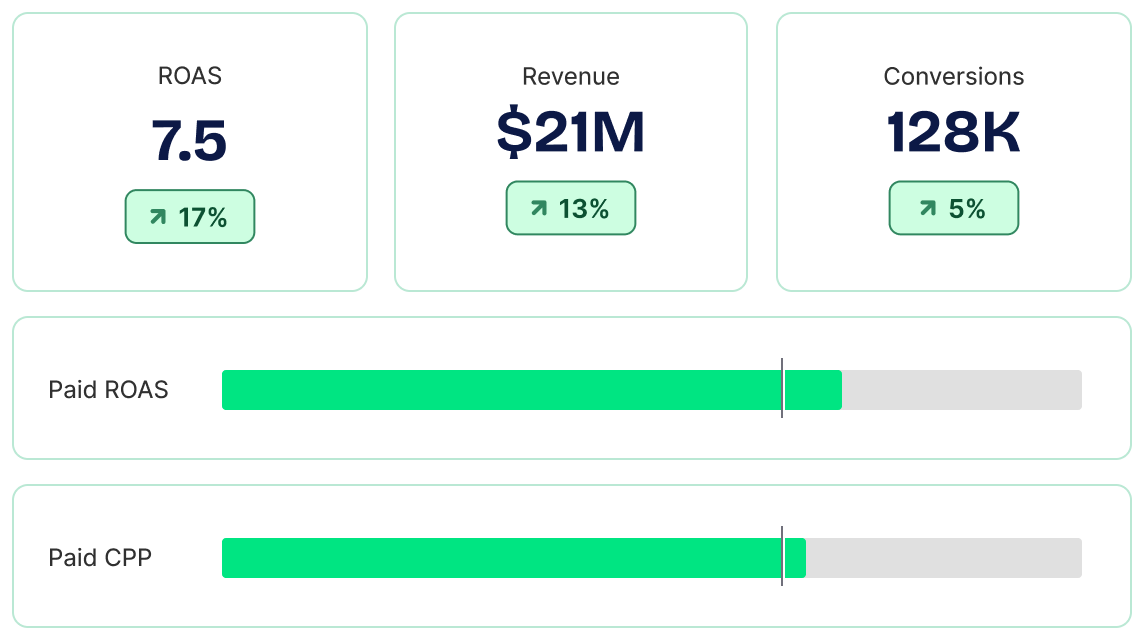
Halo: Marketplace measurement
Most measurement tools stop at Brand.com, ignoring the halo effects across marketplaces. Halo shows how your paid media contributes to sales on Amazon, TikTok Shop, and retail channels.
Halo delivers Unified Measurement — with ROAS and acquisition metrics that platform-reported data can't produce. You’ll see how Meta campaigns drive Amazon sales, how TikTok Shop contributes to .com - so that you can set budgets effectively for total revenue impact.

Glow (beta): Brand measurement
Prove the short and long-term impact of your brand spend.
Using causal modeling, Glow links awareness spend to short-term signals like branded search and engaged visits, then connects those signals to long-term gains in baseline sales, AOV, and ROAS. It shows which channels and creatives build brand equity, forecasts the long-term impact of brand campaigns, and identifies early signals of success without waiting six to ten months.
Glow translates brand performance into metrics your whole business understands, bridging the gap between upper-funnel investment and bottom-line impact.
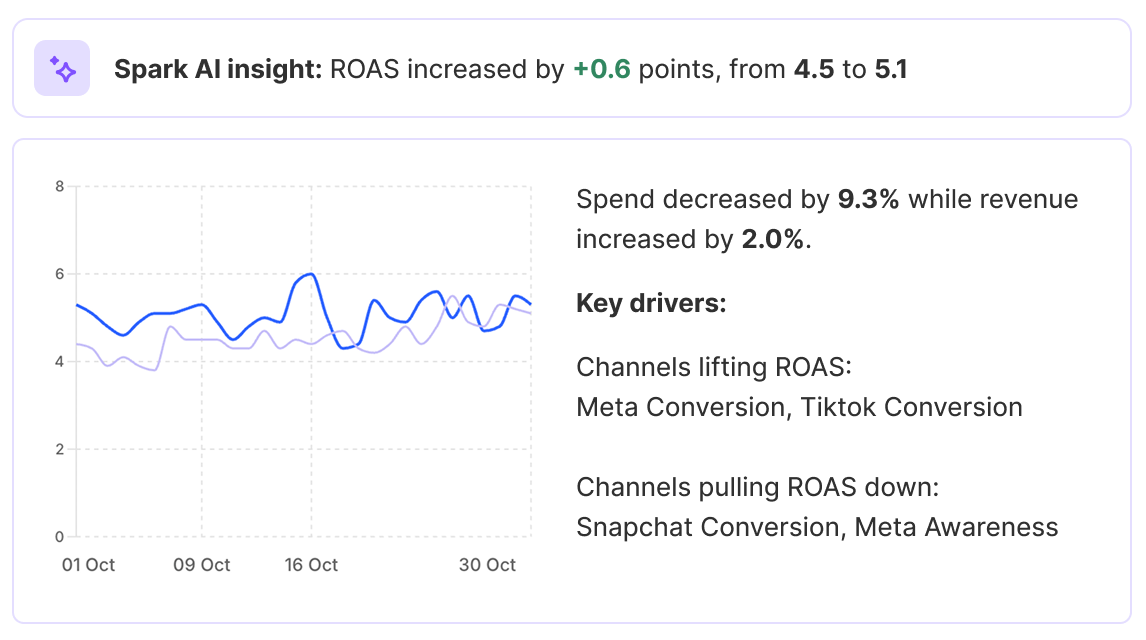
Ask Fospha AI
Inside Fospha, it's your in-dashboard marketing strategist. Ask any performance question and get the answer the moment you need it.
Outside Fospha, plug your measurement into the AI tools your team already uses — like Claude or ChatGPT. Build a workflow once and have a report land in your exec team's inbox every week.
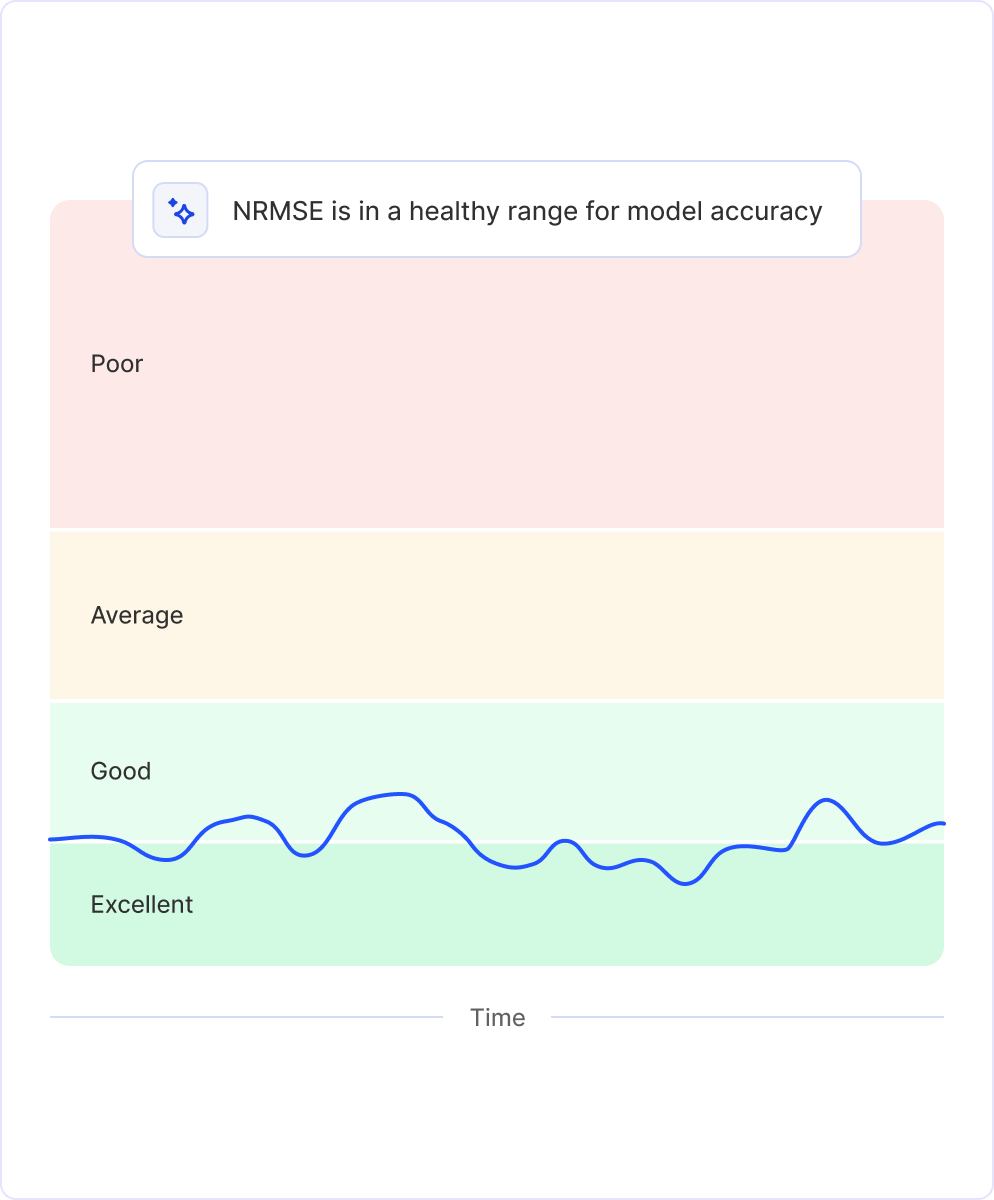
Glass-box science:
transparent measurement you can trust
Advanced marketing measurement doesn’t need to be a black box. The Glass Box is Fospha’s commitment to transparency, showing exactly how our models work, how they’re validated, and how they learn over time.
.avif)
.avif)
Hundreds of leading retail brands trust Fospha's Measurement OS


.webp)


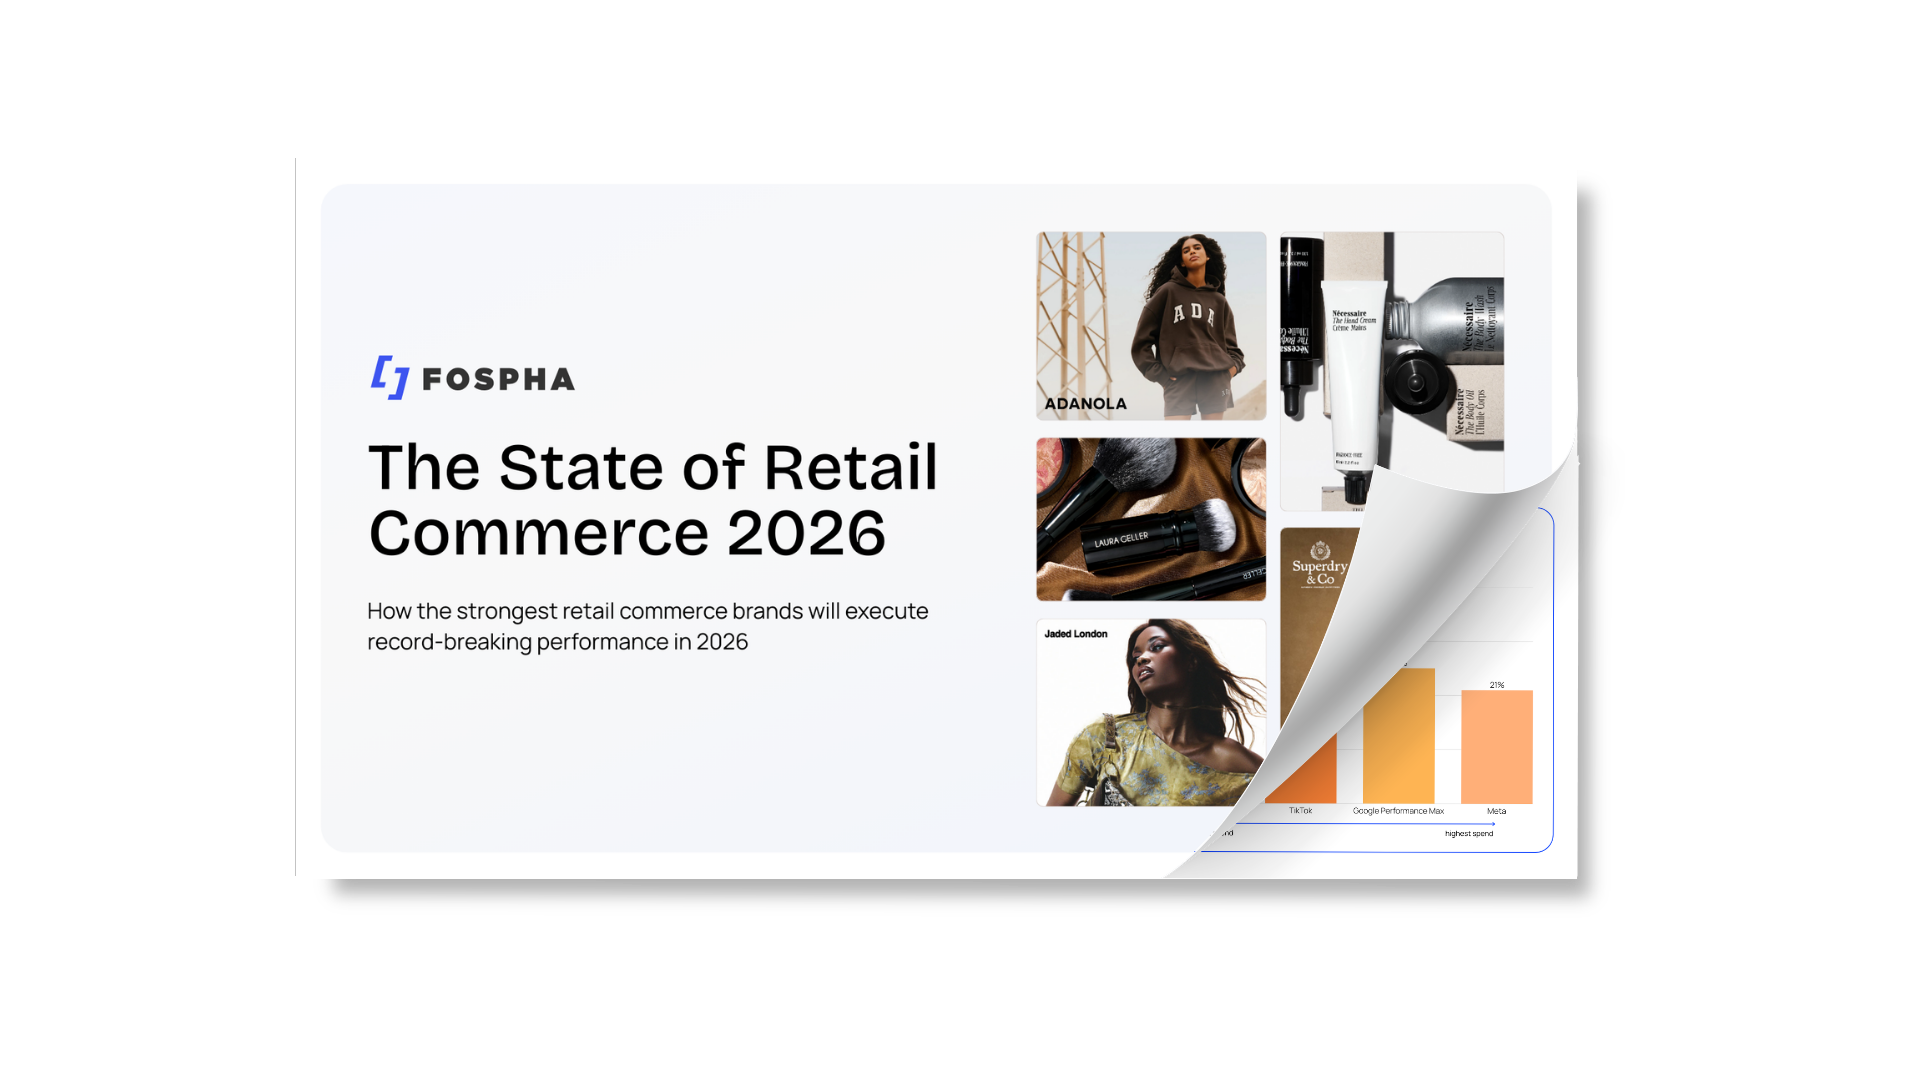
Stay ahead with the inside scoop from Fospha.
For over 10 years, we've been leading the change in marketing measurement.


.png)

.png)
.png)
.png)
.png)
.png)
.png)
.png)
.png)
.png)
.png)
.png)
.png)
.png)
.webp)


.webp)
.webp)
.png)
.webp)
.png)

FAQs
Yes. Fospha MCP connects your Fospha measurement directly to AI tools like Claude and ChatGPT - so you can ask questions about your performance data in plain language and get answers back in seconds, using the same data that's in your Fospha dashboard. No login required.
MCP works with Claude and Cursor today, with ChatGPT and Perplexity coming next. You'll need an enterprise AI account (Claude for Work, ChatGPT Enterprise, or equivalent) to connect it.
Speak to your account manager to get set up.
Getting started with Fospha is quick and painless—most of our clients are up and running in less than 28 days with minimal effort.
All we need is admin access to your ad accounts, Google Analytics, and eCommerce platform—no coding or IT department needed!
Here's how it works:
- Initial Setup (about 3 hours): We'll help you connect your data through our easy-to-use onboarding portal.
- Data Validation (1-2 weeks): We'll verify your connections while you review initial insights for accuracy.
- Go-Live (by Day 28): You're all set! Full platform access with 24 months of historical data immediately available.
Your team includes an Onboarding Specialist for setup, a Customer Success Coordinator for ongoing support, and an Account Manager to help turn insights into growth opportunities
Fospha delivers the fastest time-to-value in marketing measurement, with most clients fully live in under 28 days.
Your onboarding timeline:
- Setup (3 hours): Connect your ad platforms, GA4, and eCommerce data via our easy-to-use Onboarding Portal.
- Data Validation (1-2 weeks): We reconcile and verify your data for accuracy, ensuring seamless measurement.
- Go-Live (by Day 28): Access 24 months of historical data from day one and start optimizing your performance immediately.
We take accuracy seriously. Our model undergoes daily quality checks to ensure reliable, fair measurement you can trust. Here's how we ensure accuracy:
- Data Validation First: Before anything enters our model, we verify your tracking is consistent across platforms, identify any gaps between channels, and run daily checks to confirm outputs align with expected patterns.
- Historical Back-Testing: We prove our value by showing how our model would have accurately predicted your past performance trends, giving you confidence our recommendations are reliable.
- Outlier Capping: During major sales events like Black Friday, ad platforms typically over-claim credit. Our system automatically adjusts the outputs on high-traffic days to maintain a fair picture of what's really driving results.
Yes, Fospha is built for privacy-first measurement, today and in the future.
For 10+ years, we've led the shift away from pixel-based tracking, building our solution to meet global privacy standards like GDPR, CCPA, and iOS14+, and preparing for changes like Google’s Privacy Sandbox.
Here’s how we do it:
No third-party cookies or user-level tracking: Our model doesn’t rely on personal identifiers or outdated tracking methods
- Privacy-first by design: Fospha combines always-on measurement signal with Daily MMM to restore visibility lost to privacy changes—without compromising compliance
- Proven compliance: Trusted by global brands across the US, UK, and EU, Fospha meets the highest privacy standards
Fospha uniquely combines the best of both worlds by unifying always-on measurement signal with Daily MMM - something our competitors simply don't offer.
While platform-native dashboards miss upper-funnel impact due to signal loss, and traditional MMM lacks the speed and granularity for daily decisions, we deliver:
- The granular, ad-level measurement insights for tactical optimization
- The predictive power and total channel visibility of our Daily MMM, fairly crediting both demand generation and capture channels
Our unified approach, refined through 10+ years of working with hundreds of brands, corrects the common measurement bias toward last-touch channels - properly valuing the complete channel mix from awareness to conversion.
Fospha measures your entire channel mix, from brand awareness to conversions, giving every channel fair credit using privacy-safe Daily MMM.
We cover everything that drives growth - across web, app, and Amazon - and unify it into a single, unbiased view.
What sets us apart:
- Halo Effect: Reveal how Meta, TikTok, and Google ads drive sales on Amazon - with unified ROAS across DTC and marketplace
- TikTok Shop: Track in-app and on-site purchases together, giving you full visibility into TikTok performance beyond what Google Analytics can capture
- App Sales: We model app and web sales separately to reflect how customers behave on each platform
With Fospha, you measure what matters - no blind spots, no wasted budget, just smarter growth.
Immediately.
Fospha gives you full-funnel, privacy-safe measurement from day one—so you can optimize spend, measure true channel impact, and make smarter decisions faster. Here's how different teams benefit from Fospha from day 1:
For Performance Marketers & Growth Teams:
- Stop wasted spend & scale smarter – Use Spend Strategist to forecast ROAS, conversions, and revenue at different spend levels—helping you scale efficiently.
- Optimize within & across channels – Get ad-level insights to improve performance and shift budgets strategically, even when direct reallocations aren’t possible.
For Marketing & Finance Leaders:
- Confident, bias-free reporting – Move beyond last-click limitations with independent, privacy-safe measurement trusted by CMOs and CFOs.
- Smarter budget decisions – Use Spend Strategist to forecast the most efficient spend levels before committing budget.
- See the full impact of marketing – Get daily, MMM-powered insights that quantify brand-building and performance marketing together.
No blind spots, no wasted budget - just better decisions from the very start.